Detailed comparison of the 2.3.0 weights
MHCflurry 2.3.0 is evaluated on 16,400 positives and 164,731 negatives from ten patients (181,131 rows). Every model receives the same rows and labels; no predictor chooses its own negatives. Values are equal-patient means.
The main comparison uses peptide, MHC alleles and N/C flanking sequences for MHCflurry. A second comparison omits the flanks. NetMHCpan and MixMHCpred receive peptide and MHC inputs in both comparisons; their scores are unchanged. All rows are evaluated against presentation labels. NetMHCpan BA outputs are binding-affinity ranking baselines, not full presentation predictors.
Download the comparison figures (PDF).
See Evaluation of the 2.3.0 weights for the overview.
Full presentation: peptide, MHC and N/C flanks
MHCflurry uses both N- and C-terminal source-protein context, as it does by default when those inputs are supplied. External tools receive no flanks.
Model / output |
AP |
PPV@N |
AUROC |
|---|---|---|---|
MHCflurry 2.3.0 |
0.7986 |
0.7450 |
0.9524 |
MHCflurry 2.1.5 |
0.7766 |
0.7297 |
0.9439 |
MHCflurry 2.2.0 |
0.7766 |
0.7297 |
0.9439 |
MHCflurry 2.2.1 |
0.7766 |
0.7297 |
0.9439 |
NetMHCpan 4.0 BA |
0.6396 |
0.6178 |
0.9157 |
NetMHCpan 4.0 EL |
0.6935 |
0.6473 |
0.9243 |
NetMHCpan 4.1 BA |
0.6710 |
0.6507 |
0.9256 |
NetMHCpan 4.1 EL |
0.7671 |
0.7240 |
0.9417 |
NetMHCpan 4.2 BA |
0.6637 |
0.6456 |
0.9260 |
NetMHCpan 4.2 EL |
0.7832 |
0.7307 |
0.9455 |
MixMHCpred 3.0 |
0.7765 |
0.7281 |
0.9310 |
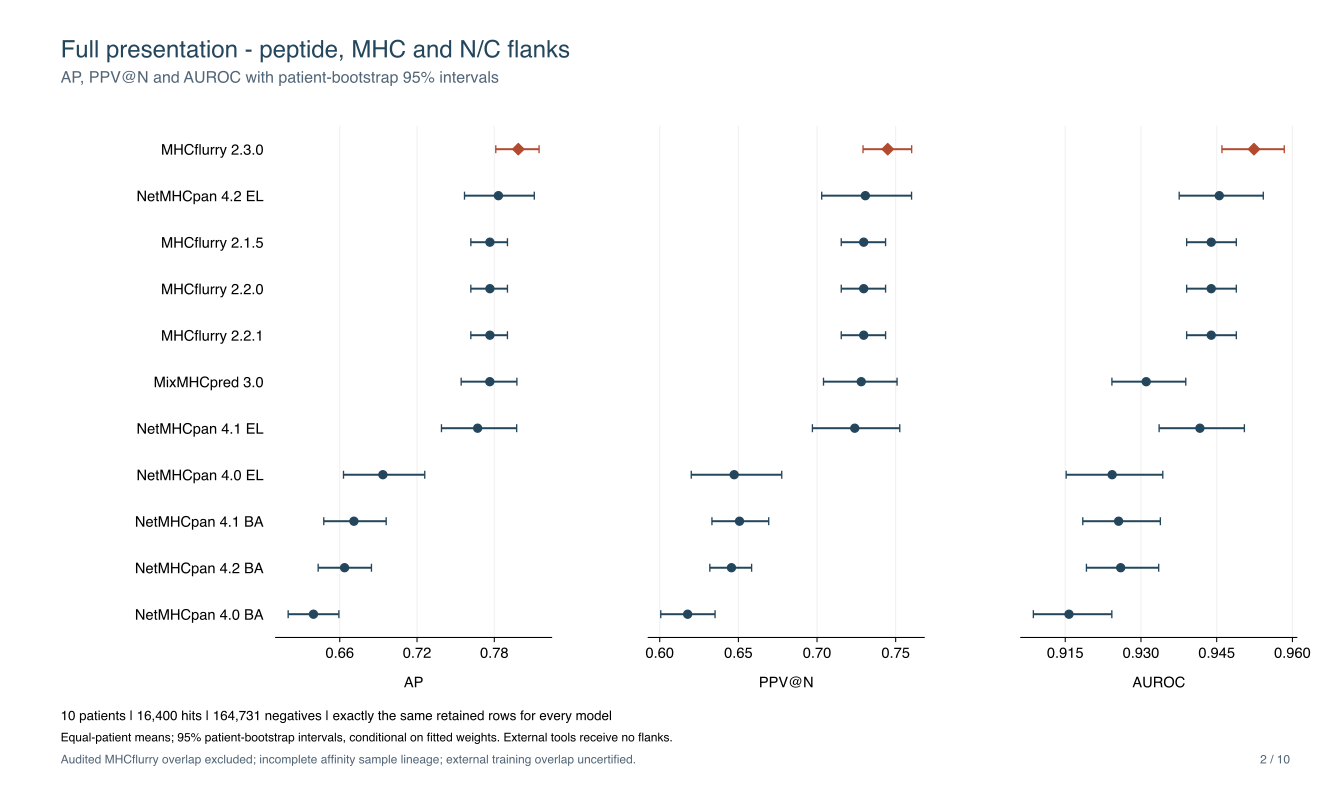
Full-model and comparator scores on the same 181,131 rows. External tools use peptide and MHC inputs without flanks.
Paired differences are MHCflurry 2.3.0 minus the comparator, with 95% patient-bootstrap intervals (10,000 paired resamples, seed 42). Positive values favor 2.3.0; intervals are not adjusted for multiple comparisons.
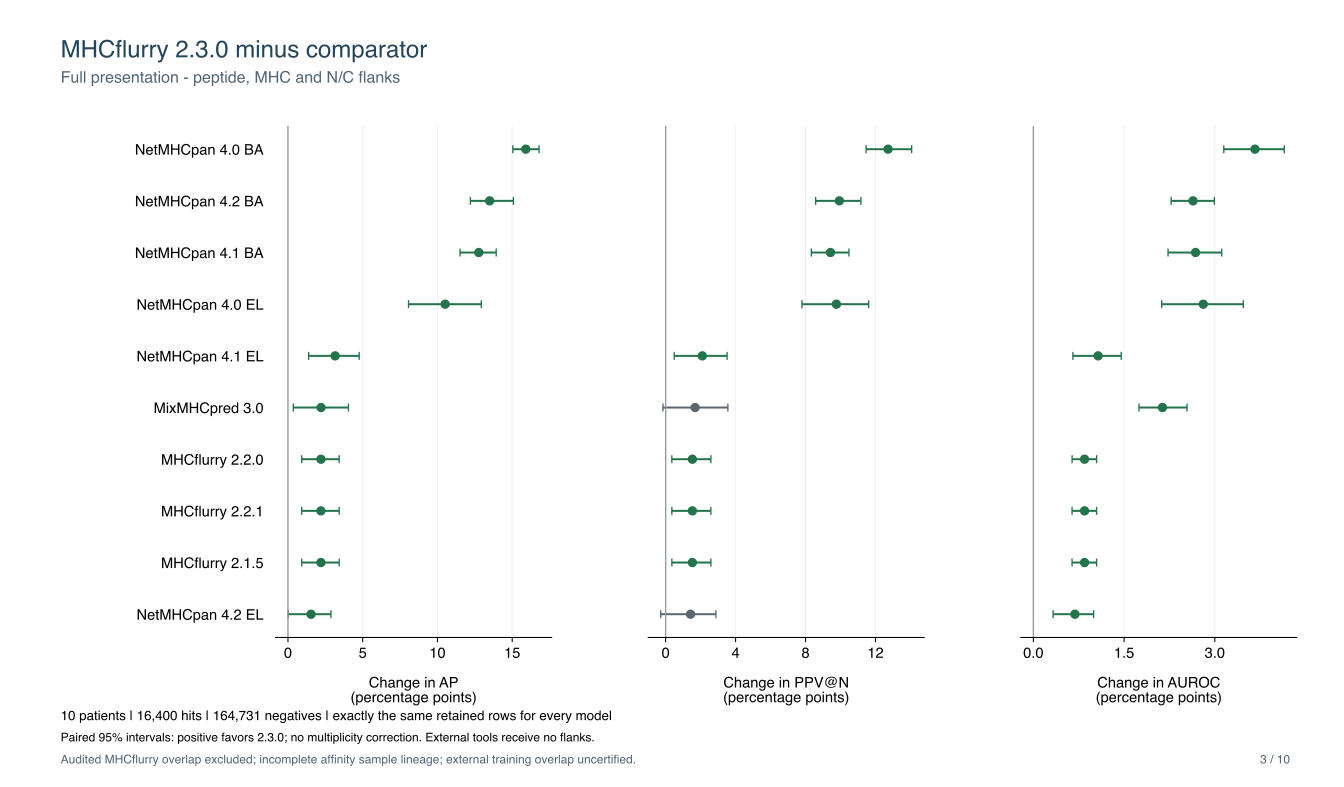
Paired patient-bootstrap intervals for MHCflurry 2.3.0 minus each comparator.
Comparator |
ΔAP [95% CI] |
ΔPPV@N [95% CI] |
ΔAUROC [95% CI] |
|---|---|---|---|
MHCflurry 2.1.5 |
+0.02205 [0.00921, 0.03424] |
+0.01528 [0.00354, 0.02586] |
+0.00846 [0.00640, 0.01046] |
MHCflurry 2.2.0 |
+0.02205 [0.00921, 0.03425] |
+0.01528 [0.00354, 0.02586] |
+0.00846 [0.00640, 0.01046] |
MHCflurry 2.2.1 |
+0.02205 [0.00921, 0.03425] |
+0.01528 [0.00354, 0.02586] |
+0.00846 [0.00640, 0.01046] |
NetMHCpan 4.0 BA |
+0.15906 [0.15044, 0.16797] |
+0.12720 [0.11462, 0.14069] |
+0.03664 [0.03149, 0.04148] |
NetMHCpan 4.0 EL |
+0.10516 [0.08064, 0.12934] |
+0.09763 [0.07798, 0.11608] |
+0.02809 [0.02122, 0.03471] |
NetMHCpan 4.1 BA |
+0.12765 [0.11511, 0.13930] |
+0.09424 [0.08331, 0.10479] |
+0.02681 [0.02227, 0.03115] |
NetMHCpan 4.1 EL |
+0.03157 [0.01382, 0.04765] |
+0.02097 [0.00490, 0.03512] |
+0.01071 [0.00654, 0.01453] |
NetMHCpan 4.2 BA |
+0.13491 [0.12200, 0.15079] |
+0.09934 [0.08576, 0.11166] |
+0.02640 [0.02278, 0.02993] |
NetMHCpan 4.2 EL |
+0.01545 [0.00013, 0.02877] |
+0.01424 [-0.00280, 0.02874] |
+0.00687 [0.00327, 0.00996] |
MixMHCpred 3.0 |
+0.02214 [0.00357, 0.04045] |
+0.01684 [-0.00153, 0.03557] |
+0.02134 [0.01747, 0.02541] |
All three paired intervals favor 2.3.0 over public 2.2.1. AP intervals also favor 2.3.0 over NetMHCpan 4.2 EL and MixMHCpred 3.0, while their PPV@N intervals include zero. The external predictors receive less input context.
No-flank comparison: peptide and MHC
MHCflurry is evaluated without flank inputs. The evaluation rows, labels and external-tool scores are identical to the main comparison.
Model / output |
AP |
PPV@N |
AUROC |
|---|---|---|---|
MHCflurry 2.3.0 |
0.7893 |
0.7373 |
0.9501 |
MHCflurry 2.1.5 |
0.7713 |
0.7258 |
0.9409 |
MHCflurry 2.2.0 |
0.7713 |
0.7258 |
0.9409 |
MHCflurry 2.2.1 |
0.7713 |
0.7258 |
0.9409 |
NetMHCpan 4.0 BA |
0.6396 |
0.6178 |
0.9157 |
NetMHCpan 4.0 EL |
0.6935 |
0.6473 |
0.9243 |
NetMHCpan 4.1 BA |
0.6710 |
0.6507 |
0.9256 |
NetMHCpan 4.1 EL |
0.7671 |
0.7240 |
0.9417 |
NetMHCpan 4.2 BA |
0.6637 |
0.6456 |
0.9260 |
NetMHCpan 4.2 EL |
0.7832 |
0.7307 |
0.9455 |
MixMHCpred 3.0 |
0.7765 |
0.7281 |
0.9310 |
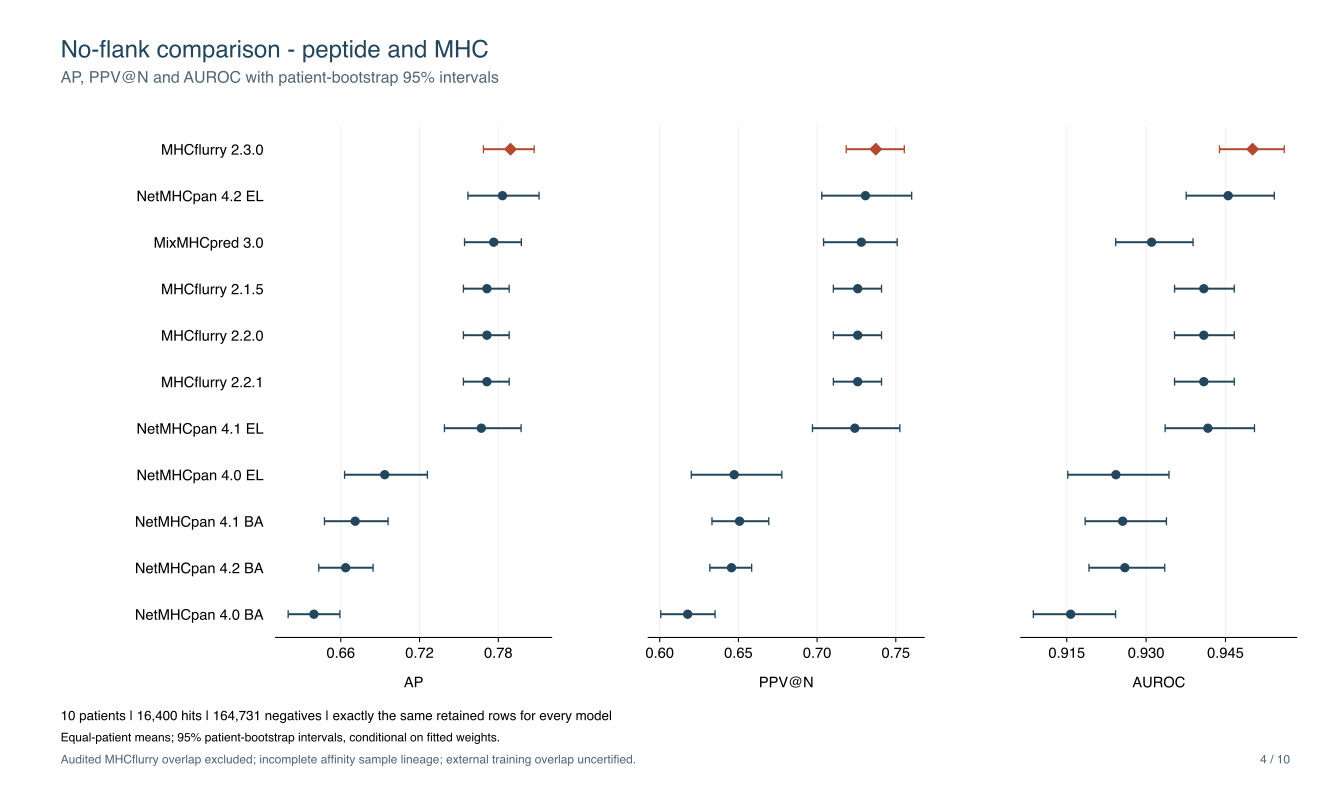
Full-model and comparator scores on the same 181,131 rows. External tools use peptide and MHC inputs without flanks.
Paired differences are MHCflurry 2.3.0 minus the comparator, with 95% patient-bootstrap intervals (10,000 paired resamples, seed 42). Positive values favor 2.3.0; intervals are not adjusted for multiple comparisons.
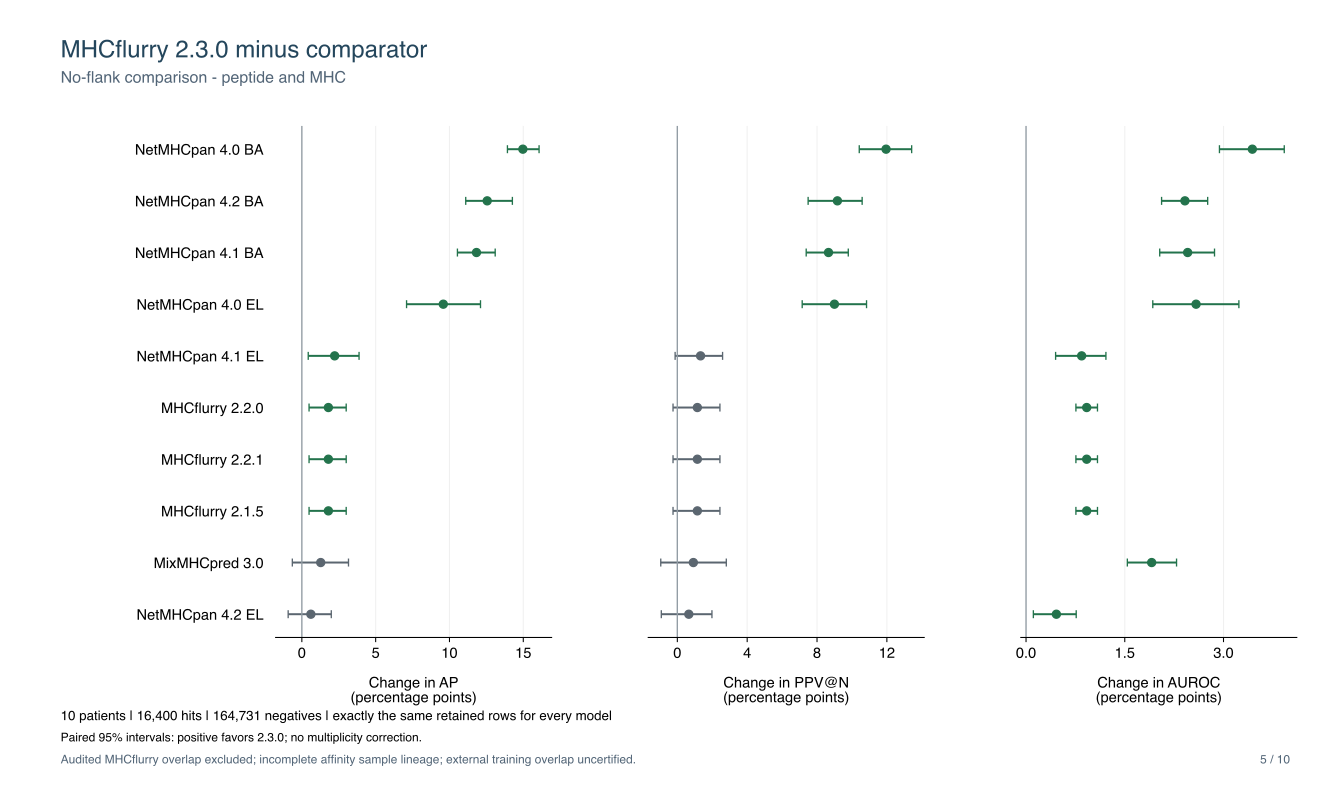
Paired patient-bootstrap intervals for MHCflurry 2.3.0 minus each comparator.
Comparator |
ΔAP [95% CI] |
ΔPPV@N [95% CI] |
ΔAUROC [95% CI] |
|---|---|---|---|
MHCflurry 2.1.5 |
+0.01797 [0.00489, 0.03004] |
+0.01148 [-0.00246, 0.02440] |
+0.00921 [0.00758, 0.01085] |
MHCflurry 2.2.0 |
+0.01797 [0.00488, 0.03004] |
+0.01148 [-0.00246, 0.02440] |
+0.00921 [0.00758, 0.01085] |
MHCflurry 2.2.1 |
+0.01797 [0.00488, 0.03004] |
+0.01148 [-0.00246, 0.02440] |
+0.00921 [0.00758, 0.01085] |
NetMHCpan 4.0 BA |
+0.14971 [0.13926, 0.16070] |
+0.11954 [0.10419, 0.13420] |
+0.03438 [0.02938, 0.03923] |
NetMHCpan 4.0 EL |
+0.09581 [0.07093, 0.12102] |
+0.08997 [0.07151, 0.10836] |
+0.02583 [0.01926, 0.03234] |
NetMHCpan 4.1 BA |
+0.11830 [0.10539, 0.13098] |
+0.08658 [0.07381, 0.09791] |
+0.02455 [0.02031, 0.02864] |
NetMHCpan 4.1 EL |
+0.02222 [0.00433, 0.03875] |
+0.01331 [-0.00126, 0.02592] |
+0.00845 [0.00449, 0.01214] |
NetMHCpan 4.2 BA |
+0.12556 [0.11102, 0.14262] |
+0.09168 [0.07491, 0.10584] |
+0.02414 [0.02059, 0.02759] |
NetMHCpan 4.2 EL |
+0.00610 [-0.00927, 0.01994] |
+0.00658 [-0.00917, 0.01983] |
+0.00461 [0.00111, 0.00762] |
MixMHCpred 3.0 |
+0.01279 [-0.00645, 0.03160] |
+0.00918 [-0.00949, 0.02805] |
+0.01909 [0.01539, 0.02287] |
AP and AUROC intervals favor 2.3.0 over public 2.2.1; the PPV@N interval includes zero. AP and PPV@N differences versus NetMHCpan 4.2 EL and MixMHCpred 3.0 also have intervals including zero. These results do not establish universal superiority.
Cohort and overlap
A separate benchmark builder sampled source-protein/length-matched negative
windows, with seed 20260928 and an initial ten negatives per positive. Sampling
did not use scores from either the old or new predictor. The final overlap
audit removed an additional 380 rows (101 positives and 279 negatives) from
every comparator without resampling. The revised cohort SHA256 is
9f0fbc92fd44ac58438102ae7496687b67f109685d8f1fecfc820a7262bf46cc;
the previous cohort SHA256 was
81d18501616358b3c4b0f87d6e405ed50ea67dfefa31d6f8097d39818d658b41.
The cohort is disjoint from the inventoried MHCflurry training peptide sources. Unavailable or incomplete training records, especially for external predictors, prevent claiming disjointness from every model ever trained.
Ten patients limit precision and generalizability. The release changed both recipes and data, so its gains cannot be attributed solely to newer data. PPV@N uses the retained positive count in each patient, with expected precision across score ties.
Components and artifacts
Affinity-only ligand-ranking AP increased from 0.6971 to 0.7224 versus public 2.2.1. Processing-only AP decreased: 0.4144 versus 0.5399 with flanks and 0.4243 versus 0.5794 without flanks. These are component rankings on the presentation cohort, not independent quantitative affinity or isolated processing endpoints. The full presentation improvements therefore do not imply that every component improved. Task AP values are never averaged.
The with-flanks predictor contains four short-flank and four cleavage-boundary networks. The separately trained long-flank ensemble is a diagnostic and is not used in that full predictor. The saved presentation-percentile mapping preserves the raw-score AP, PPV@N and AUROC on the complete revised cohort.
Download the aggregate comparison tables and figures. The archive holds full-precision aggregate tables, rendering code, and a separately labeled prerelease component comparison.
The stable-model tables above and the PDF include public 2.1.5/2.2.0/2.2.1, NetMHCpan 4.0/4.1/4.2 BA and EL, and MixMHCpred 3.0. They do not include MixMHCpred 2.0.2, whose incomplete coverage required a different subset. Model archive checksums accompany the 2.3.0 release.
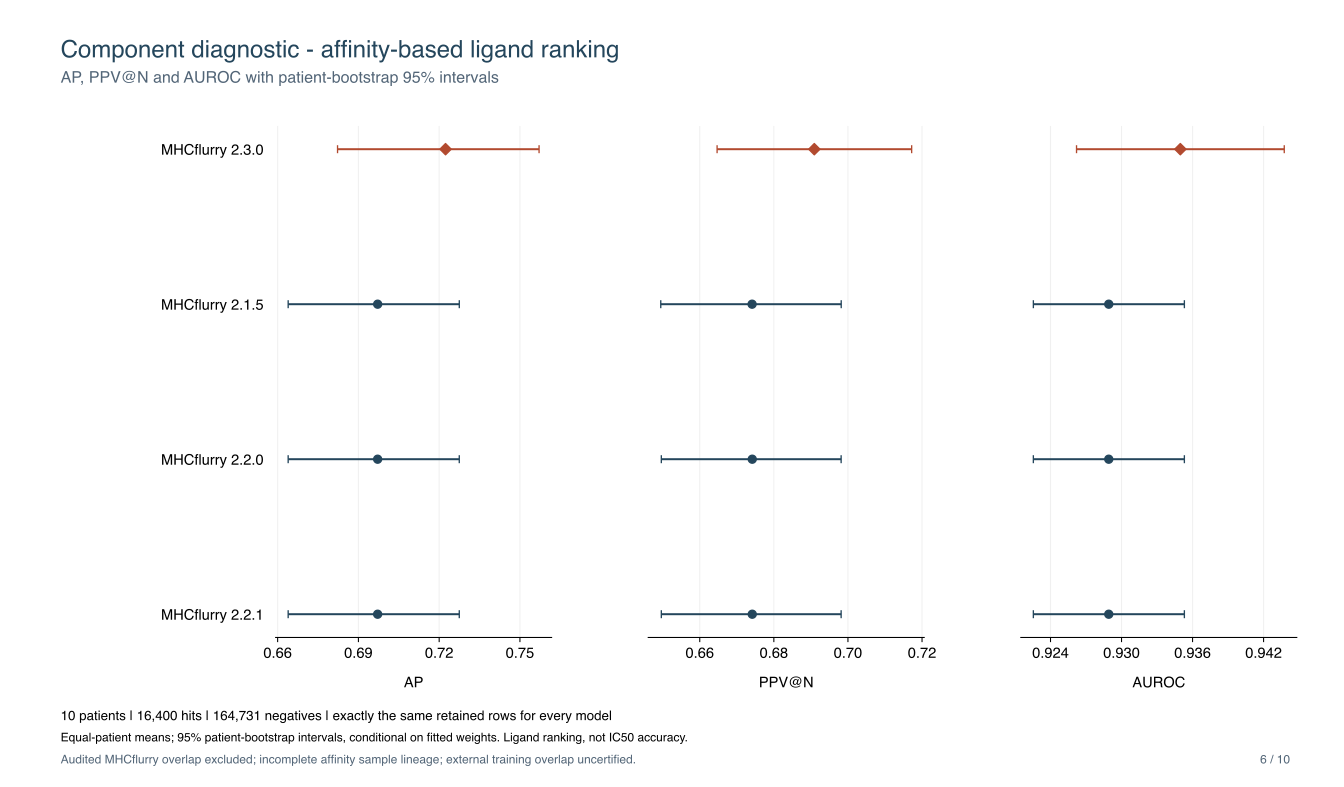
Affinity-based ligand ranking on the presentation cohort; this does not measure quantitative IC50 accuracy.
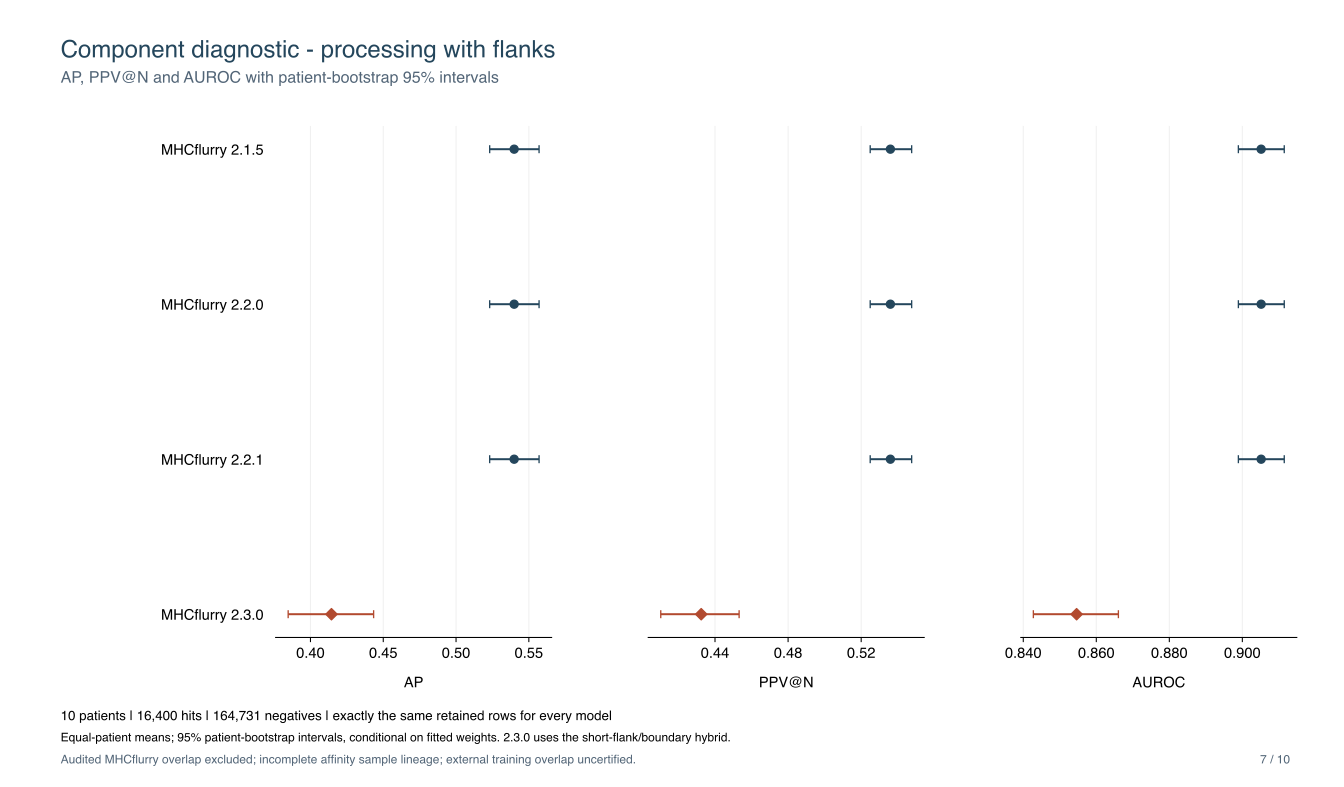
Processing-only ranking with N/C flanks. The 2.3.0 component is the short-flank/boundary hybrid used by the full predictor.
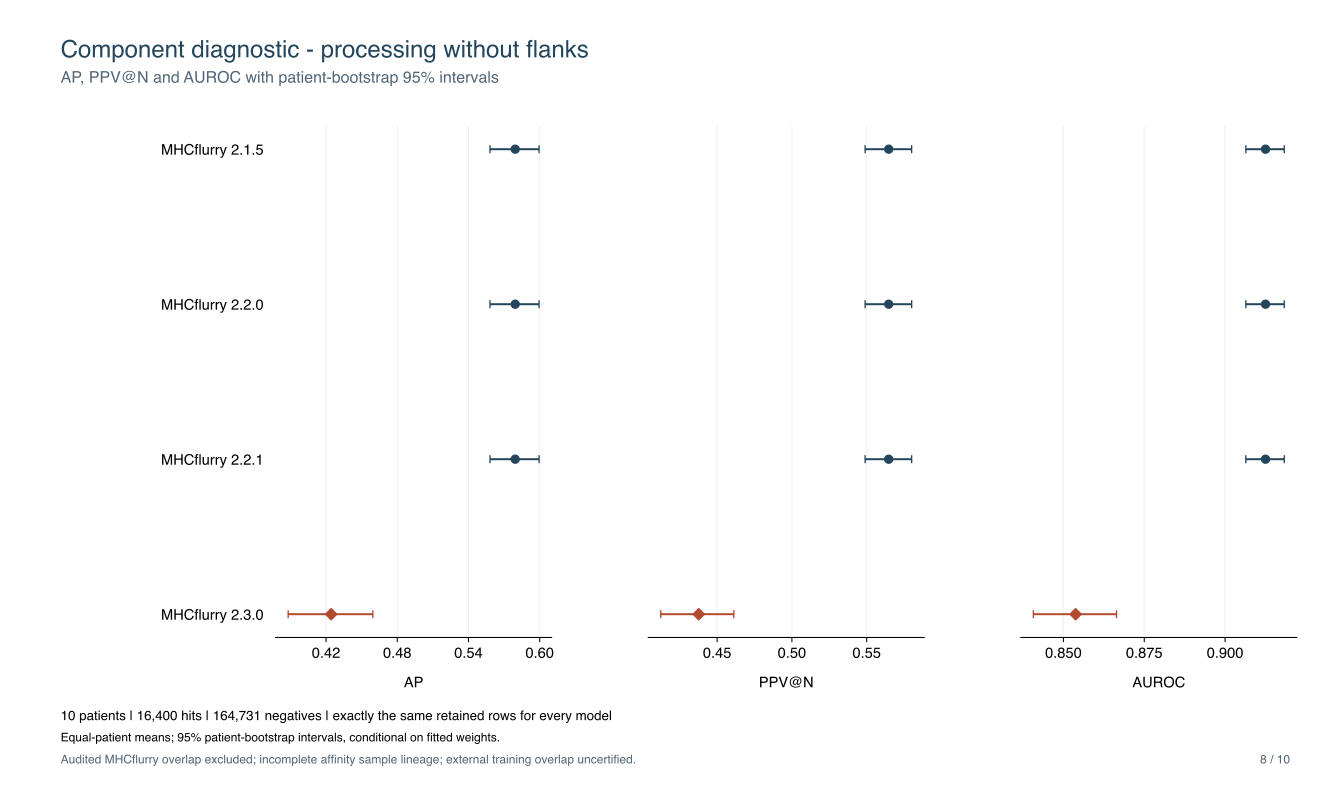
Processing-only ranking without flanks. Component metrics are not averaged with full presentation metrics.
Prerelease comparison: 2020 versus 2023 training data
The labels 2.3.0-pre — 2020 training data and 2.3.0-pre — 2023 training data describe two prerelease runs of the same recipe family. The year refers to the curated affinity-data snapshot. These are experimental configurations, not additional downloadable weight releases.
The 2023 prerelease run saved affinity and with-flanks processing components, but no full presentation model. Only the available component rankings are compared here, on the same 181,131 rows as every figure above. They must not be read as full-model presentation scores or combined into an average task AP.
The processing architectures also differ: the 2020 score uses four short-flank and four boundary networks, whereas the 2023 score uses eight networks with 15-residue flanks. This is not a controlled data-only ablation. The released 2.3.0 full predictor above uses the completed short-flank/boundary hybrid.
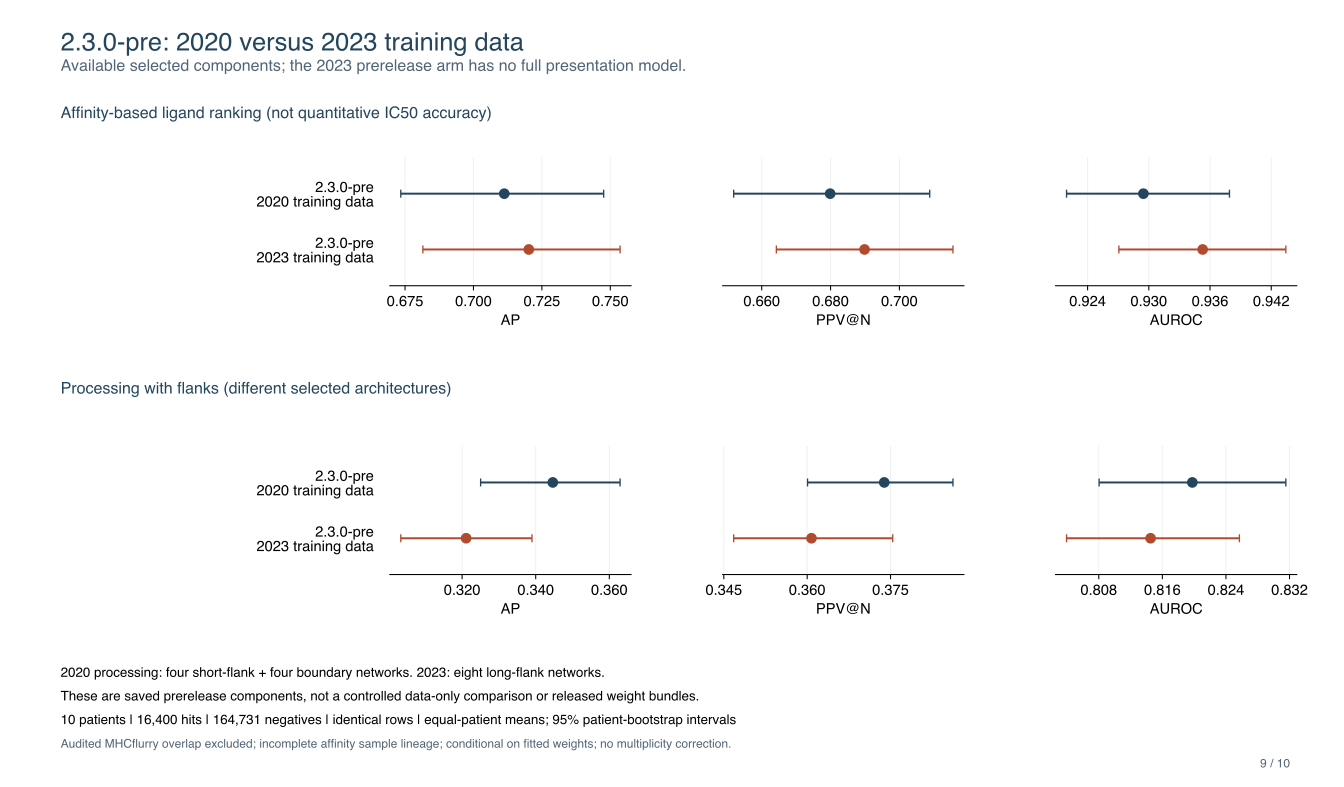
Available prerelease components; the 2023 arm has no full presentation model. Processing architectures differ.
Component |
Training data |
AP |
PPV@N |
AUROC |
|---|---|---|---|---|
Affinity ligand ranking |
2020 |
0.7113 |
0.6799 |
0.9295 |
Affinity ligand ranking |
2023 |
0.7202 |
0.6899 |
0.9353 |
Processing with flanks |
2020 |
0.3446 |
0.3739 |
0.8198 |
Processing with flanks |
2023 |
0.3211 |
0.3608 |
0.8145 |
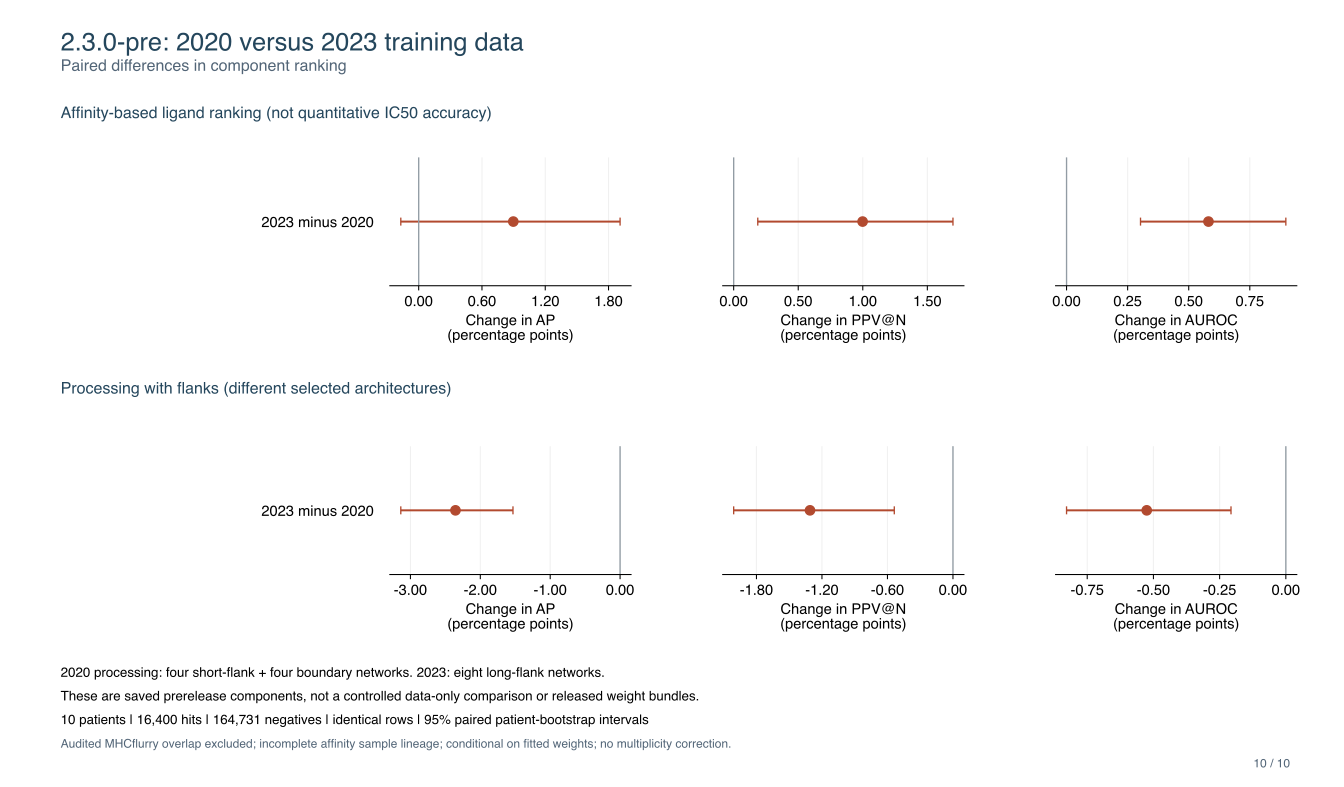
2023 minus 2020 component rankings, with 95% paired patient-bootstrap intervals. Positive values favor the 2023 arm.
Component |
ΔAP [95% CI] |
ΔPPV@N [95% CI] |
ΔAUROC [95% CI] |
|---|---|---|---|
Affinity ligand ranking |
+0.00897 [-0.00170, 0.01910] |
+0.00999 [0.00187, 0.01698] |
+0.00581 [0.00303, 0.00897] |
Processing with flanks |
-0.02355 [-0.03138, -0.01533] |
-0.01310 [-0.02009, -0.00537] |
-0.00525 [-0.00828, -0.00207] |
The affinity AP interval includes zero; its PPV@N and AUROC intervals favor the 2023 arm. The processing intervals favor the scored 2020 hybrid, with the architecture caveat above. All intervals are conditional on the saved weights and unadjusted for multiple comparisons. The training-overlap and cohort limitations stated above apply unchanged.